Revision 82dd582045b2ec890b46e78d5419389be4916146 (click the page title to view the current version)
Experiments/EdgePlasmaPhysics/ParticleFlux/RakeProbe/1114ShotToShotMeasurement/Sessions/1114Intro/index
Langmuir probe VA characteristics measurement of the standard GOLEM tokamak plasma
Aim: to measure VA characteristics on the shot to shot basis.
##Experimental setup
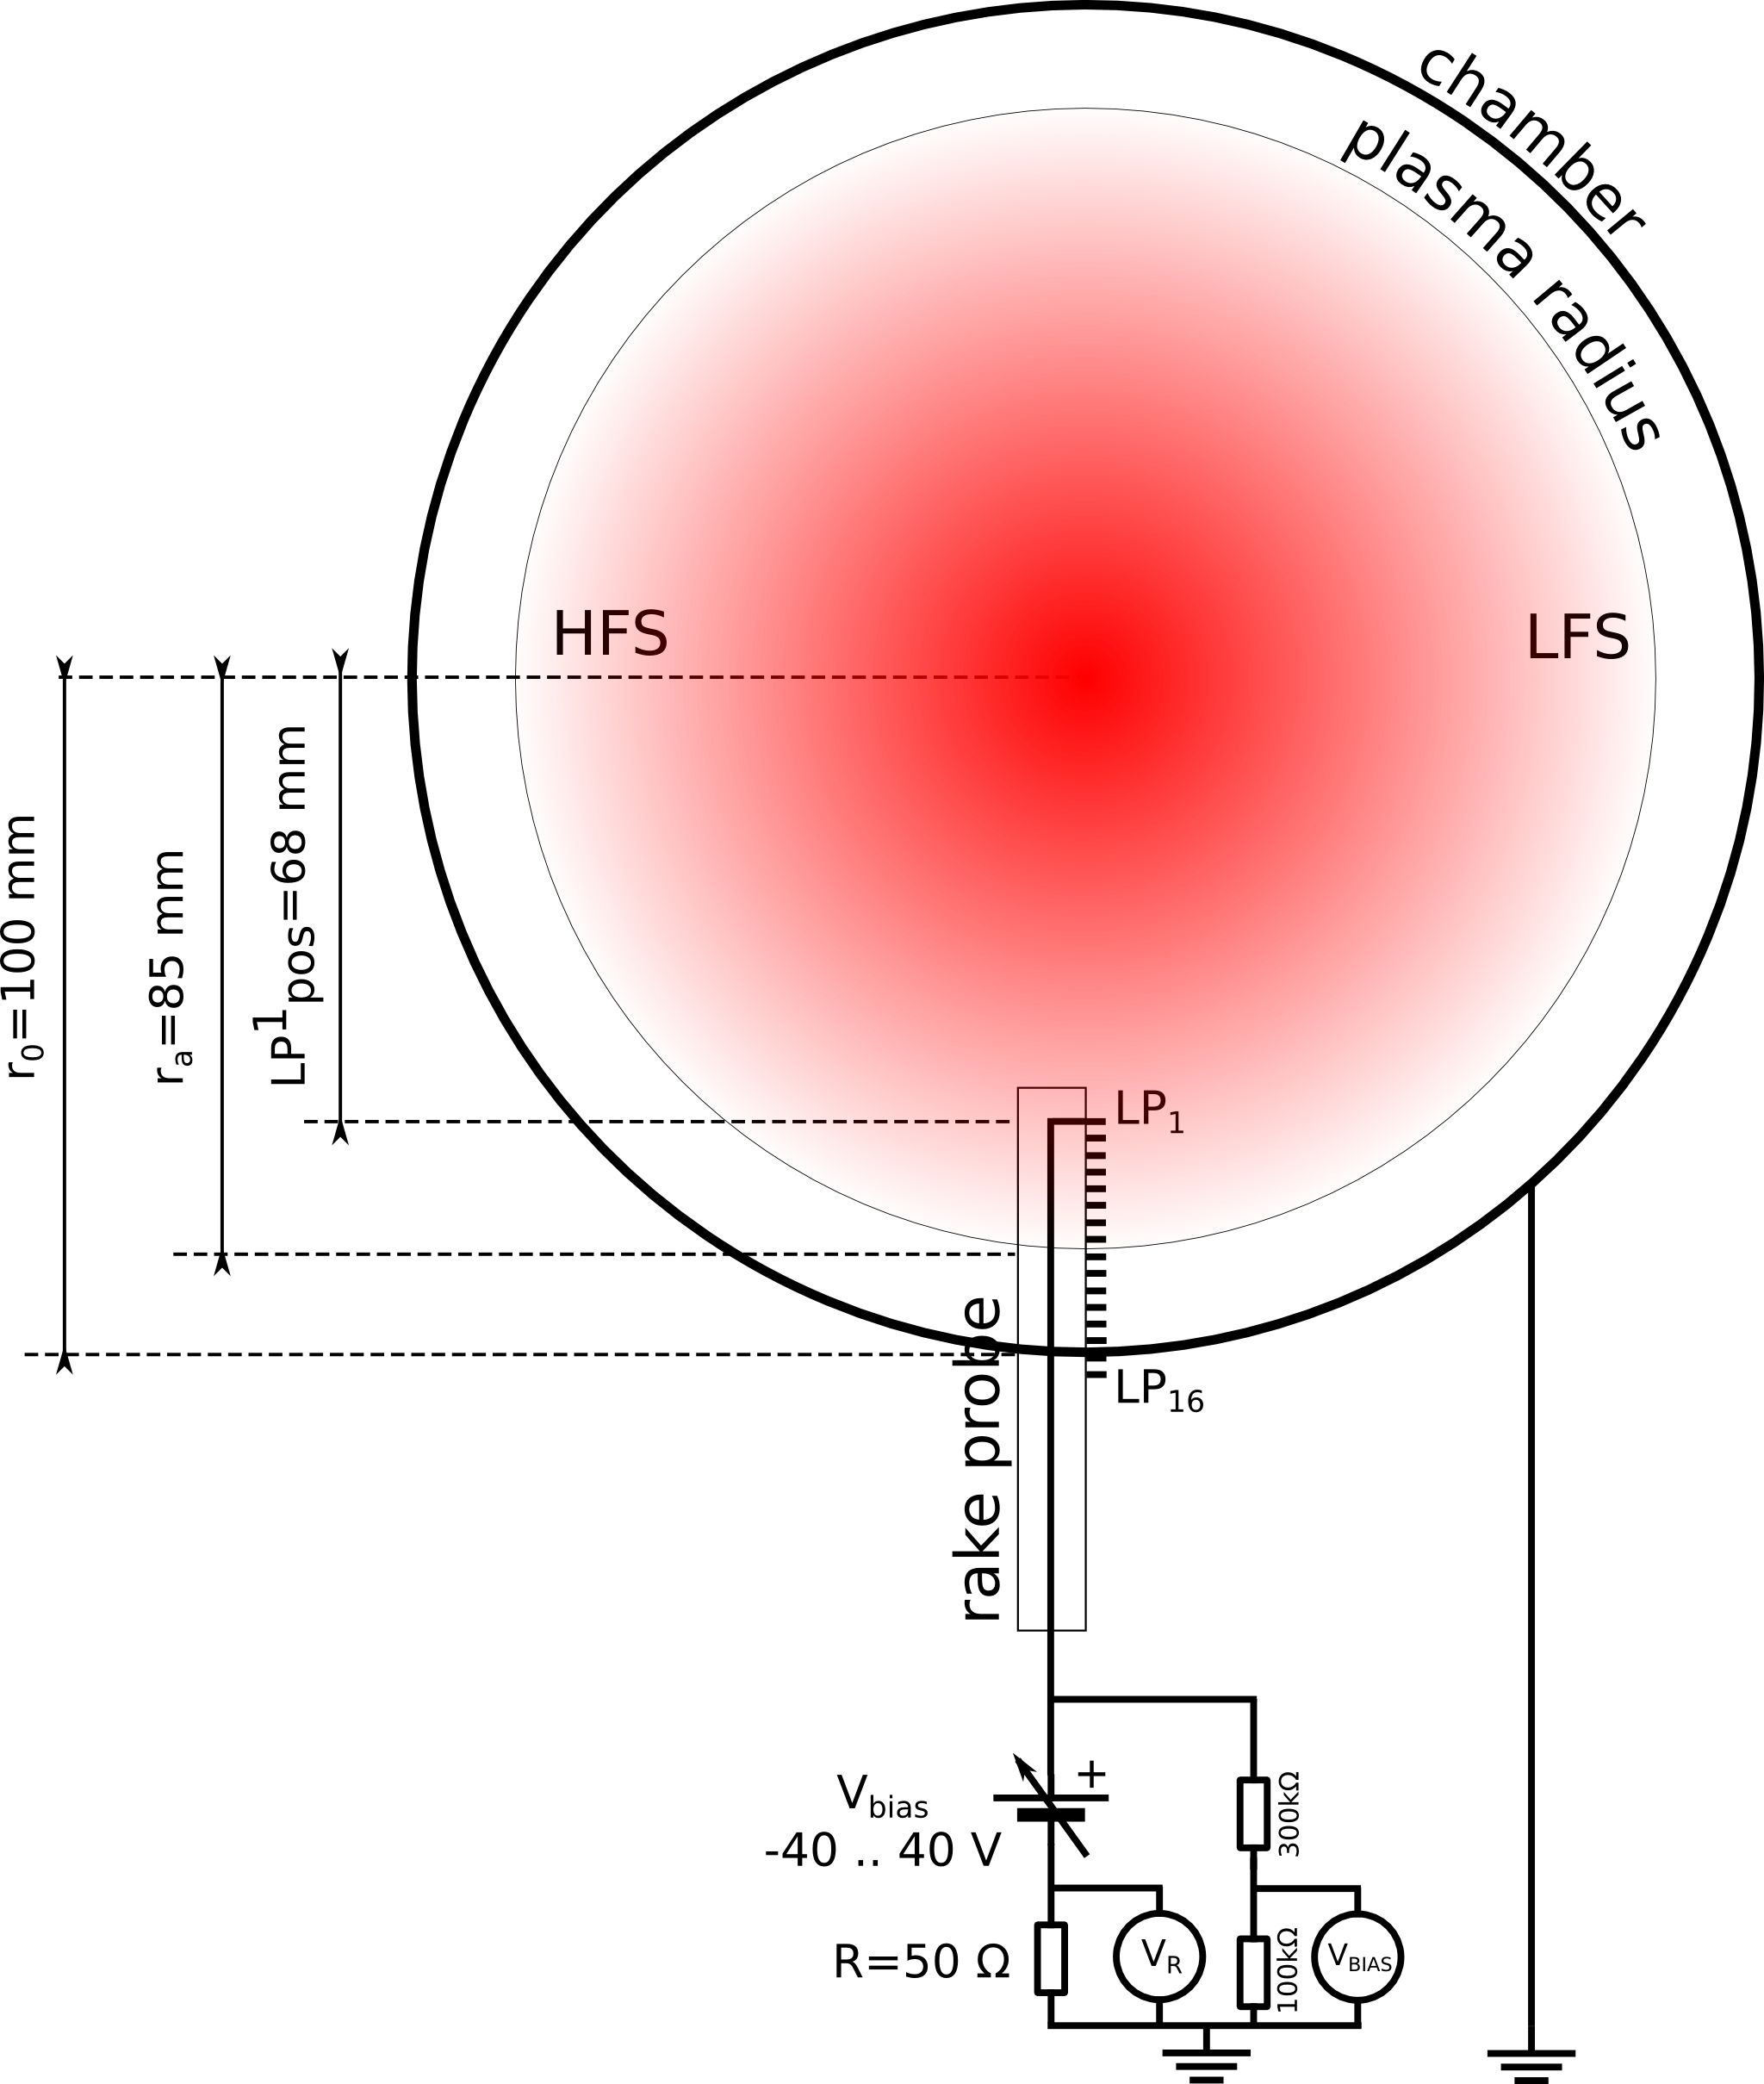
##Theory
###Initial configuration:
- Date: Afternoon 261114
- LP position of 1st pin from the vessel center \(LP_{pos}=107\) mm,
- \(V_{bias}\) off,
- \(R=100\) Ohm:
- LP orientation: pins ahead SouthEast (in the port direction), i.e. probe is oriented perpendicularly to the magnetic field lines
- Discharge setup: –UBt 800 –Ucd 500 –Tcd 10000 –Tres 2000 –pressure 1 –preionization 4
- Preionization: ECR wave
- \(V_{bias}\) measured with 1:100 divider
###Minutes of the experiment:
| Aim | Shot(s) | Comments |
|---|---|---|
| Reference shot | #17717 | |
| Switching on \(V_{bias}\) to ~ 10V | #17718 | OK, \(V_{bias}\) goes to ~0.1V |
| Lp to position \(LP_{pos}\) = 54 mm | #17719 | \(I_{sat}\) too high ~ 100 mA |
| Galvanic insulation implemented for V_bias power supply | #17720 | Satisfactory, no problem |
|
Since \(I_{sat}\) is too high, Let’s decrease R to 50 Ohm |
#17721 | Better, but still \(V_R\) ~9V |
|
Since \(I_{sat}\) is still too high, Let’s take out LP to position 68 mm |
#17722 to #17726 fails | |
| #17727 OK | No effect, still \(V_R\) ~9V | |
|
HS discussion: configuration OK reverse \(V_{bias}\) polarity to -10 V to measure \(I_{is}\) |
#17728 to #17733 fails | |
| #17734 OK | Hopefully good result | |
| \(V_{bias}\) = {-20,-30,-40} V | #17735,#17736,#17737 | OK, ready for scan |
| Scan \(V_{bias}\) = {-40,-35,-30,-25,-20,-15,-10,-5,0,1,2,3,4,5,6,7,8,9,10,12} V | From #17739 to #17762 | see Figs. 1, 2, 3, 4 |
###Final experiment configuration:
- LP position of 1st pin from the vessel center \(LP_{pos}=68\) mm,
- \(V_{bias}\) from -40V (#17739) to 12V (#17762),
- \(R=50\) Ohm:
- LP orientation: pins ahead SouthEast (in the port direction) i.e. probe is oriented perpendicularly to the magnetic field lines
- Discharge setup: –UBt 800 –Ucd 500 –Tcd 10000 –Tres 2000 –pressure 1 –preionization 4
- Preionization: ECR wave
- \(V_{bias}\) measured with 1:100 divider
- Length of pin: 2 mm, diameter of the pin: 0.7 mm => pin surface ~ 3.140.7210^-6 m^2 ~ 4.410^-6 m^2
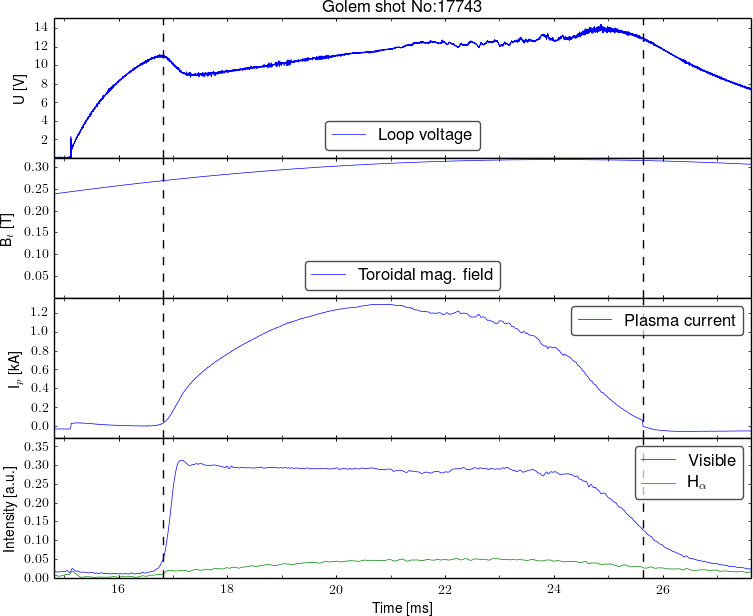
##Reference shot #17743
Reproducibility of the GOLEM tokamak discharge from #17739 to #17762

\(I_{p}\) scan - alltogether (jpg, svg,canvas,script)
##Raw experimental data

Fig.1: \(V_{bias}\) scan - alltogether (jpg, svg,canvas,script)

Fig.2: \(V_{bias}\) scan - ion side (jpg, svg,canvas,script)

Fig.3: \(V_{bias}\) scan - electron side (jpg, svg,canvas,script)

Fig.4: \(V_{bias}\) scan - alltogether \(U_{bias}\) (jpg, svg,canvas,script)
##Analysis ### Raw data - VA characteristics at specific time with \(10\mu s\) averaging.
VA characteristics fit
- Inspiration came from Aasim Azooz: Langmuir probe data analysis code. Mathworks, see manual and from Nicholas James Behlman: Electron Energy Distribution Measurements in the Plume Region of a Low Current Hollow Cathode. Master thesis at Worcester Polytechnic Institute
- VA characteristics is fitted to the function \[I=\exp[a_1 \tanh{(V+a_2)/a_3}]+a_4 \]
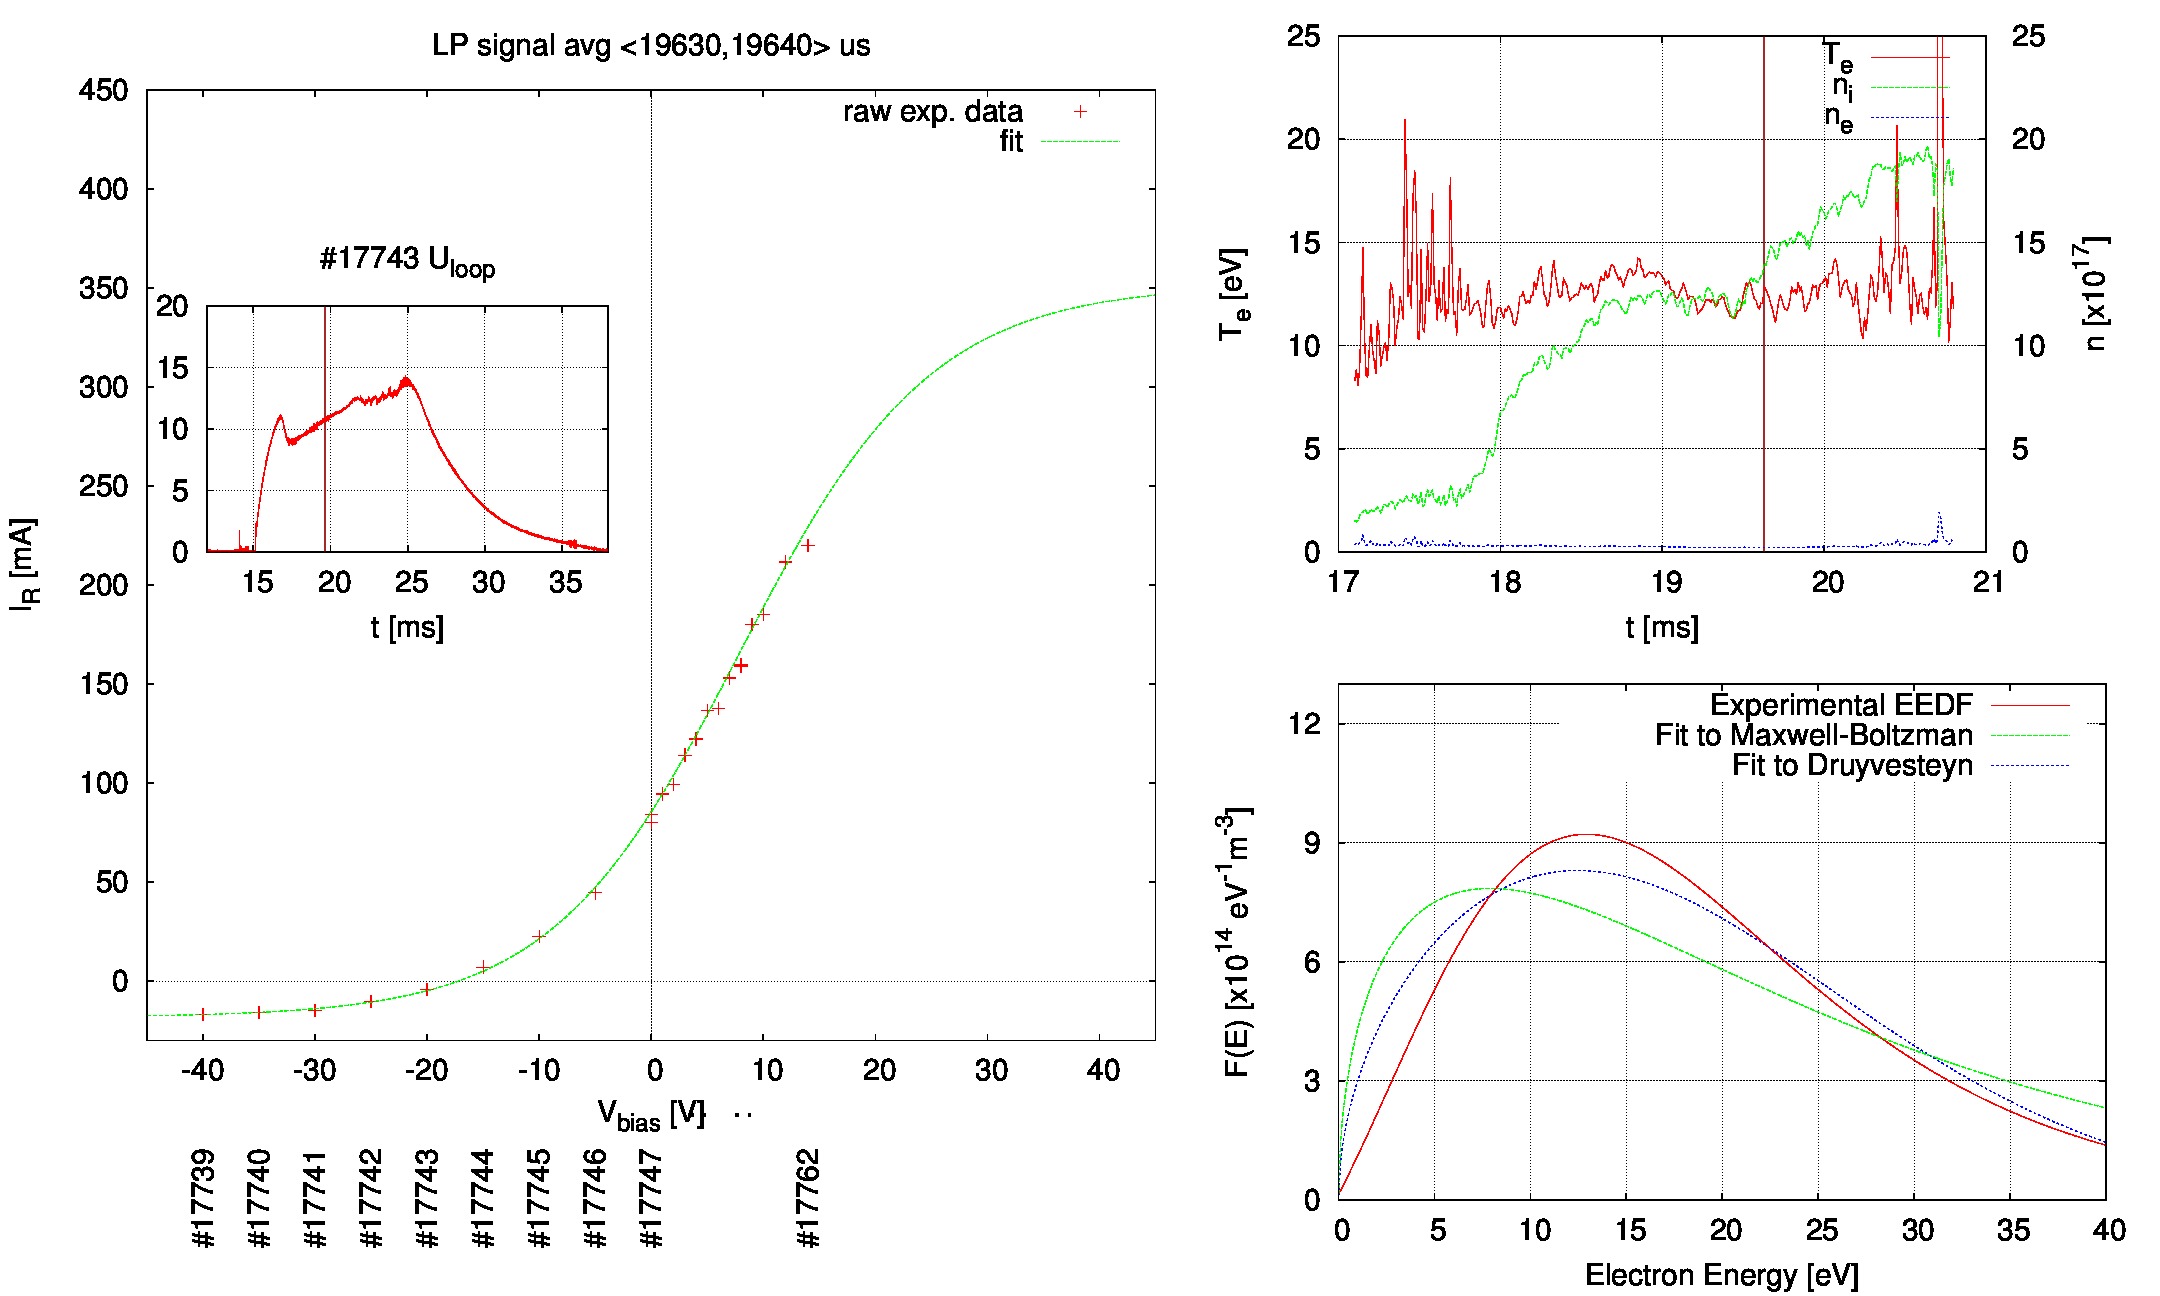
Resulting dependeces
- Directory with files
Electron saturation current
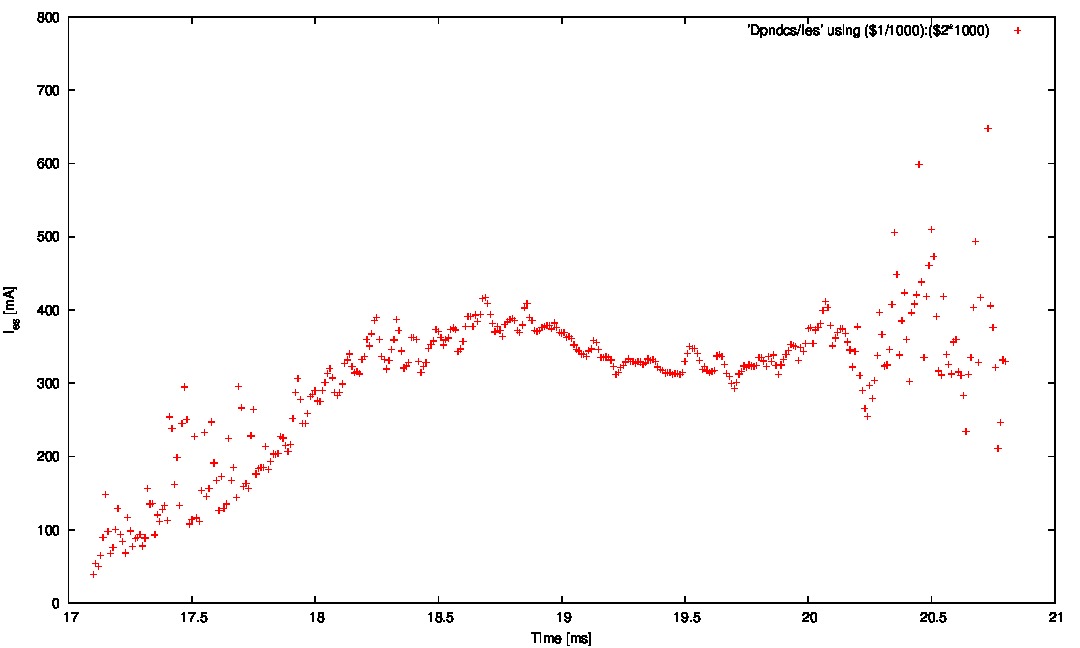
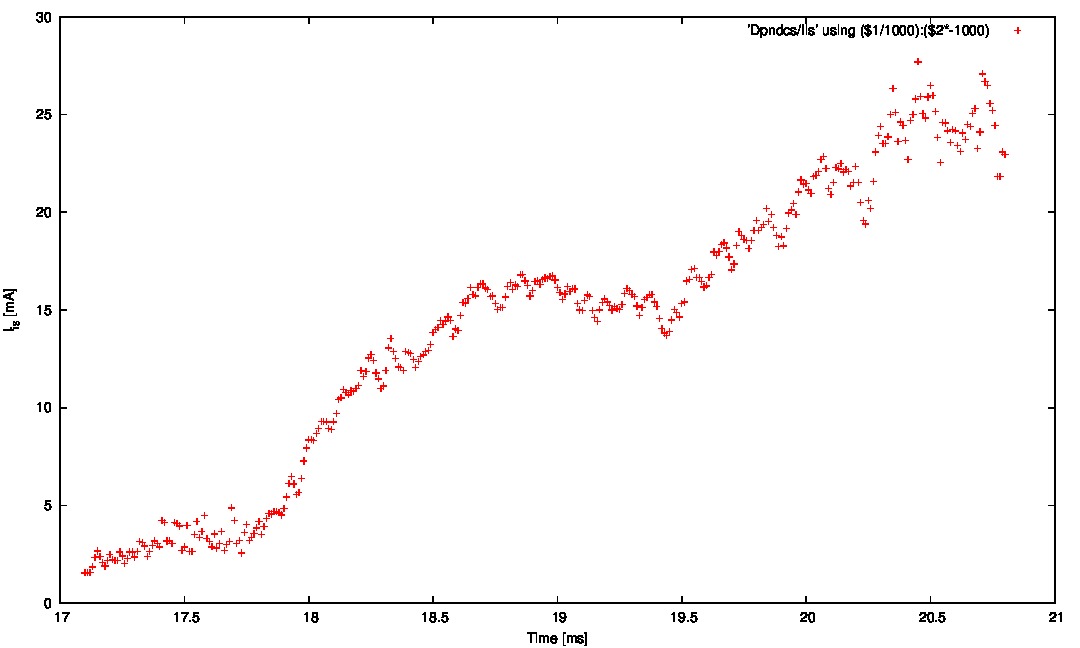
Ion saturation current
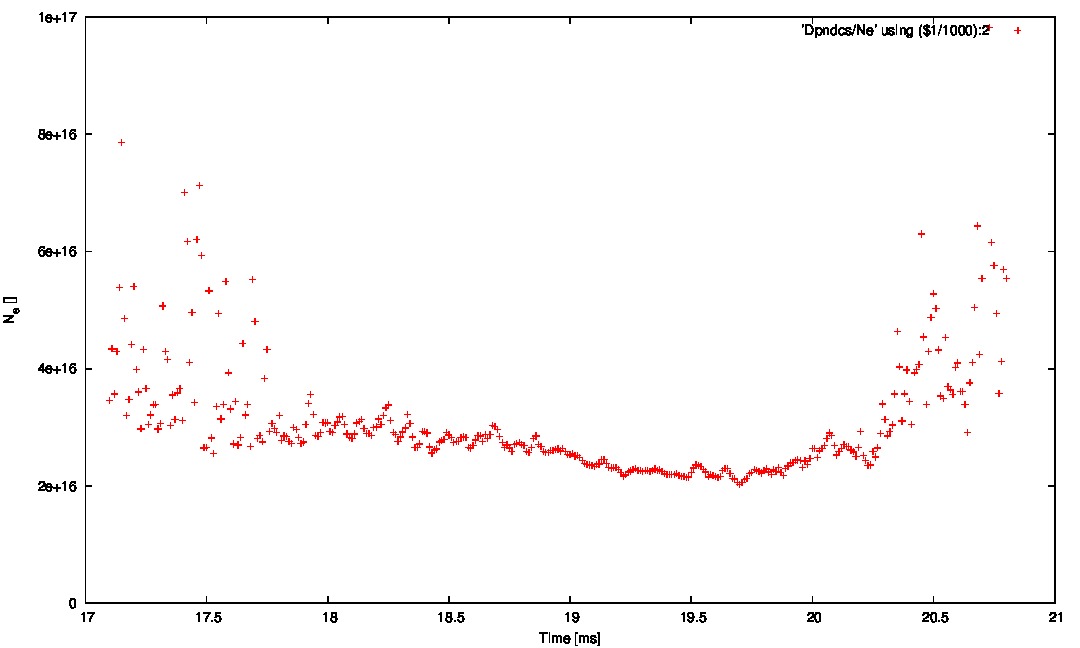
Electron density
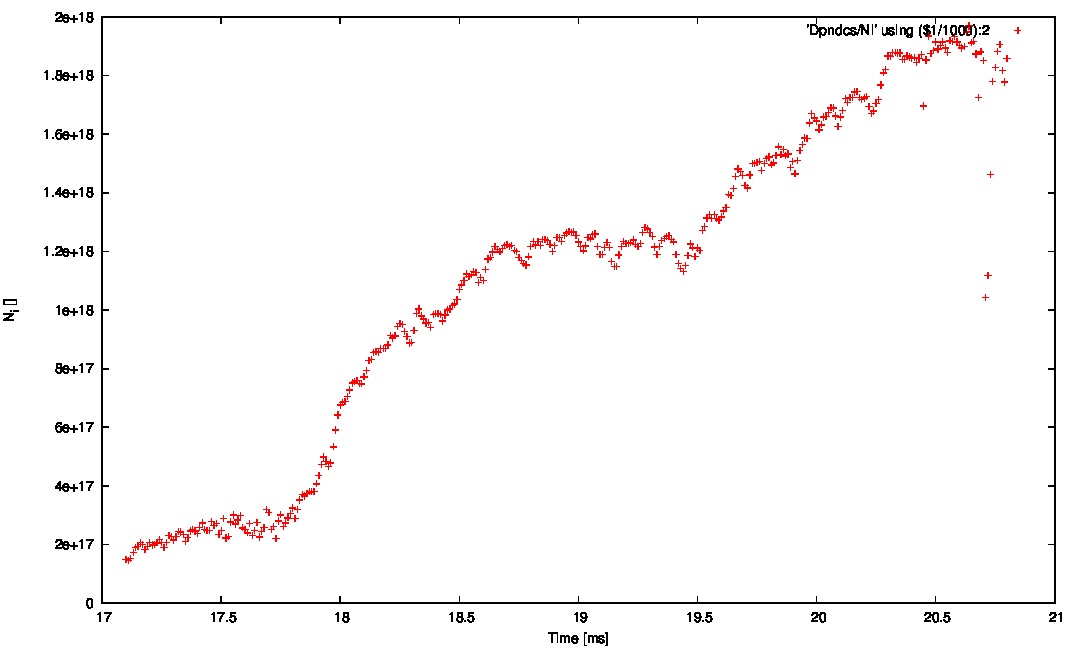
Ion density
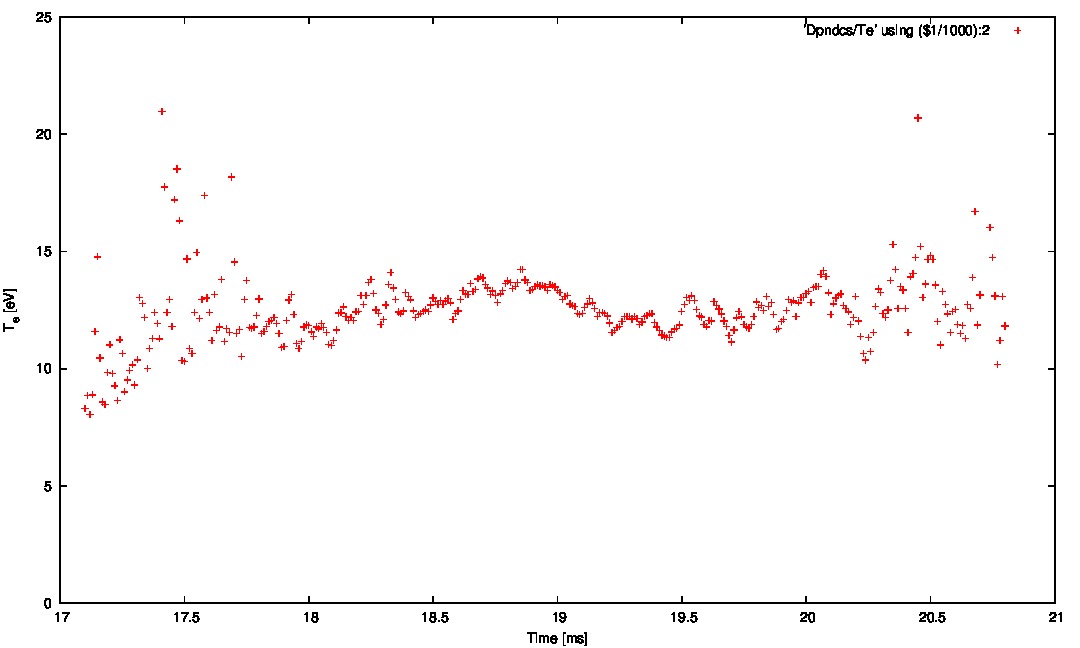
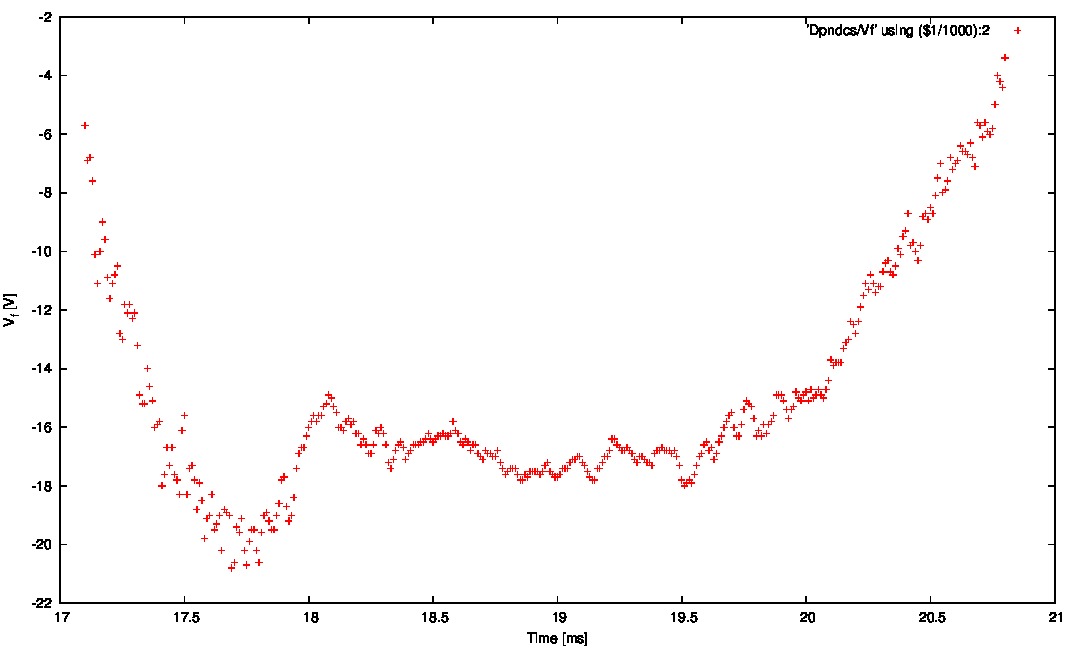
Electron temperature
Floating potential
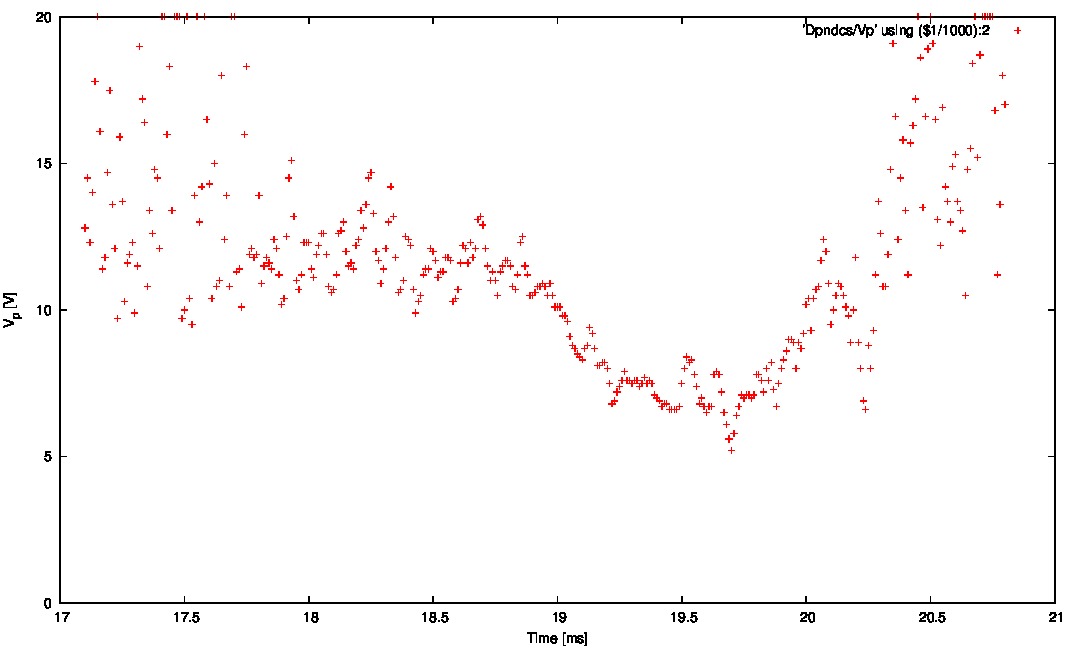
Plasma potential
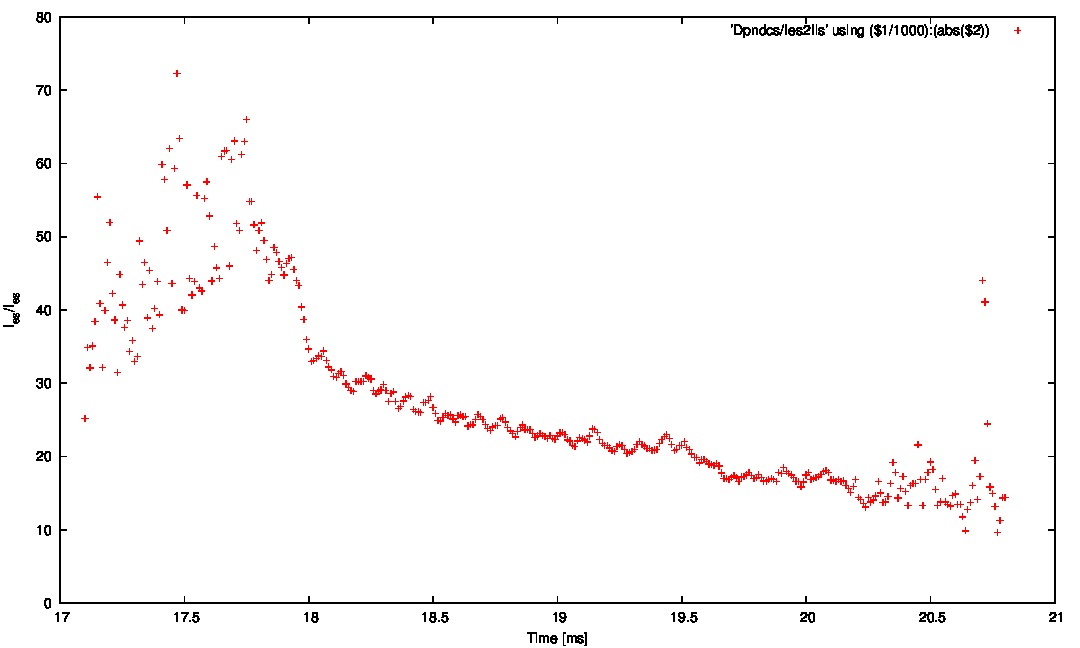
\(I_{es}/I_{es}\) ration
Discussion
- The reason for the VA char vanish in the end of the discharge could be fact, that the GOLEM plasma is normally moving up as can be seen here (#11405):
Note the rake probe seen in the photo.
Data access
- Raw data directory
- <#ShotNo>v_r: \(V_R\) reflecting current via Langmuir Probe @ \(R=50\Omega\)
- <#ShotNo>param_2: abs(Biasing voltage)
- \(10\mu s\) averaged data at specific times directory
- <#Time>raw.dat, where #Time \(in <14000,28000> \mu s\) with \(10 \mu s\) step in 2 column format: \(V_{bias}\), \(V_R\).
- Files in directory, where #Time \(\in <14000,28000> \mu s\) with \(10 \mu s\) step
- <#Time>raw.dat in 2 column format: \(V_{bias} [V]\), \(I_{Lprobe} [A]\).
- <#Time>Bt.dat in 1 single data format: \(B_t [T]\).
- <#Time>d2f.dat: second derivative of the VA characteristics fit (available during plasma life from 17100 to 20800 us).
- <#Time>eedf.dat: Experimental EEDF (available during plasma life from 17100 to 20800 us).
- <#Time>fm.dat: Maxwell-Boltzman fit to experimental EEDF (available during plasma life from 17100 to 20800 us).
- <#Time>fd.dat: Druyvesteyn fit to experimental EEDF (available during plasma life from 17100 to 20800 us).
- Individual figures directory, where #Time \(\in <14000,28000> \mu s\) with \(10 \mu s\) step
- Toroidal magnetic field evolution \(B_t\) of the #17743
Codes used
References:
- David Pace:Example of Langmuir Probe Analysis
- Aasim Azooz: Langmuir probe data analysis code. Mathworks.
- Nicholas James Behlman: Electron Energy Distribution Measurements in the Plume Region of a Low Current Hollow Cathode. Master thesis at Worcester Polytechnic Institute
EEDF
- [Annette Meiners @COMSOL: Electron Energy Distribution Function](http://www.comsol.com/blogs/electron-energy-distribution-function/)
